
Note
Go to the end to download the full example code.
Compute distance field#
This example shows how to segment an image and compute the distance field of several phases
import matplotlib.pyplot as plt
import spam.datasets
import spam.filters

import spam.mesh
Read the data from datasets and convert#
im = spam.datasets.loadConcreteNe()
# tifffile is reading images in the z,y,x order
sizeZ = im.shape[2]
print("Encoded type: {} -> max={}, min={}".format(im[0, 0, 0].dtype, im.max(), im.min()))
plt.figure()
plt.imshow(im[sizeZ // 2, :, :], cmap="Greys")
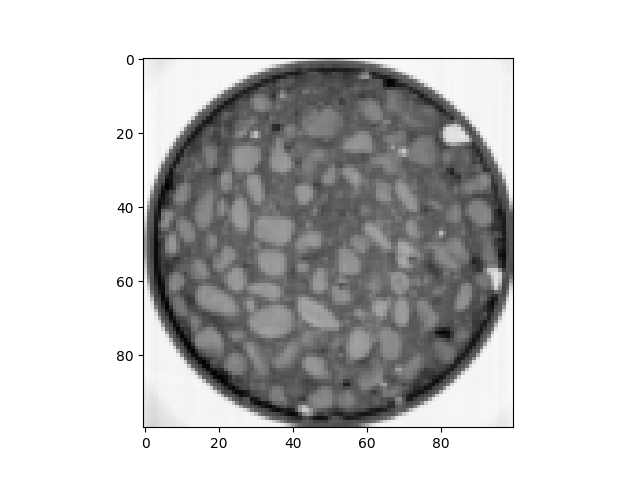
Encoded type: uint16 -> max=65535, min=2866

<matplotlib.image.AxesImage object at 0x7f11a78481c0>
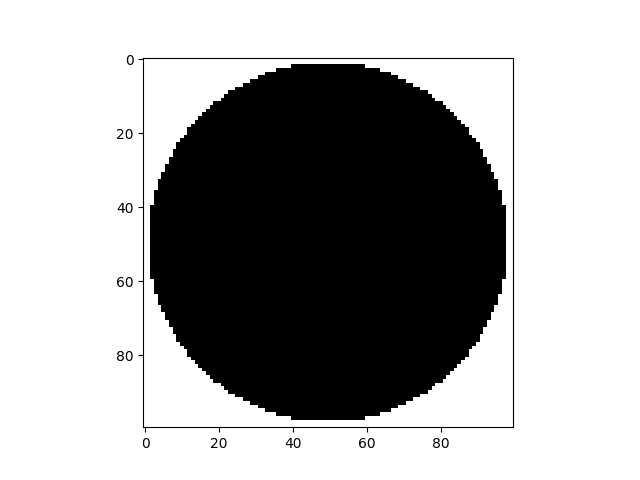
Cylindrical mask#
In order to ignore the ouside of the specimen, a cylindrical mask is created.
cyl = spam.mesh.createCylindricalMask(im.shape, 48.5)
plt.figure()
plt.imshow(cyl[sizeZ // 2, :, :], cmap="Greys")
<matplotlib.image.AxesImage object at 0x7f11a7d228f0>
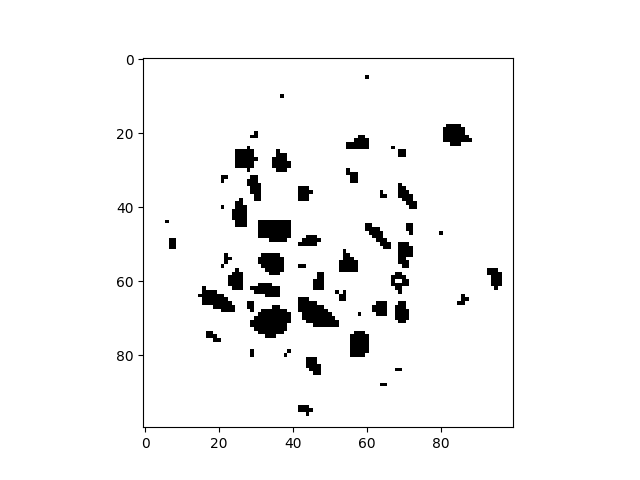
Threshold#
With a threshold of 36000 it should only keep the inclusions. The outside of the specimen is ignored thanks to the cylindrical mask.
binIm = (im < 36000) * cyl
plt.figure()
plt.imshow(binIm[sizeZ // 2, :, :], cmap="Greys")
<matplotlib.image.AxesImage object at 0x7f11a7d22140>
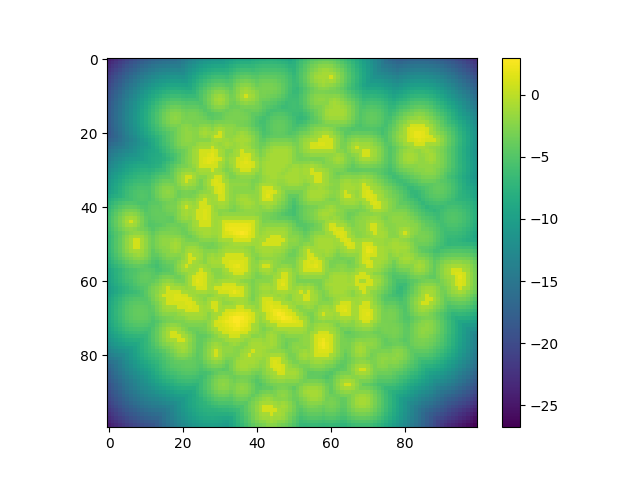
Distance field#
The distance field generates by default a field of floats between -1 and 1 with positive values inside the inclusions, negative values outside and 0 at the border.
dist = spam.filters.distanceField(binIm)
plt.figure()
plt.imshow(dist[sizeZ // 2, :, :])
plt.colorbar()
plt.show()
Total running time of the script: (0 minutes 0.520 seconds)